



The sensors under the M1 and M2 platforms
Accuracy
8.7%
Average Difference From a Blood Test
averaged across the two sensors these platforms read (published data, 2 sensors)
Reference standard
Reference blood glucose
Sample size
Based on 2 sensors
The sensors the Ultrahuman M1 and M2 platforms read land 7.8% and 9.6% from a laboratory blood test — in the manufacturers’ own published trials, not in ours.
7.8%the M1 sensor, against a laboratory reference
9.6%the M2 sensor, against a laboratory reference
93.4%of M1 readings within 20% or 20 mg/dL
6,845paired sensor-and-blood readings behind the M1 figure
Within minutes of a first bite glucose climbs, peaks and settles again, and the body works to keep that whole swing inside a narrow band. A sensor cannot sit in the bloodstream to watch it happen. A filament finer than a hair rests in the fluid between cells just under the skin, where glucose arrives a little later and a little softened, and turns it into a tiny electrical current. Holding that conversion steady for the whole life of a sensor, through sweat, sleep, pressure and changing skin temperature, is demanding.
Ultrahuman does not manufacture the sensor. The M1 and M2 platforms read third-party continuous glucose monitors, and which one ships depends on where you are. The two numbers in the chart above are not Ultrahuman’s measurements. Each is the sensor manufacturer’s own published result against laboratory blood analysis, and each is given here with the document it comes from, so it can be checked rather than taken on trust.
The M1 figure is the sensor’s pivotal trial, published in Diabetes Therapy in 2023: an overall mean absolute relative difference of 7.8% against a laboratory analyser, over 6,845 paired readings in 95 participants, with 93.4% of readings inside 20% or 20 mg/dL of the reference across the full measured range. The M2 figure comes from that sensor’s United States clearance file, which reports accuracy period by period across the sensor’s life rather than as one number; weighting those four periods by how many readings each contributed gives 9.6%.
The two are not a like-for-like comparison, and the distance between them is mostly about how each was tested rather than about the hardware. The M1 figure comes from a purpose-run trial across the sensor’s full measured range. The M2 sensor was cleared on a re-analysis of an earlier generation’s clinical dataset, over a narrower glucose range, by a regulator that asked for the numbers period by period — and the earliest period, when a freshly inserted filament is still settling, is the worst of the four and pulls the weighted figure up. Different studies, different references, different ranges: each figure is a statement about the sensor it describes, not a ranking of one against the other.
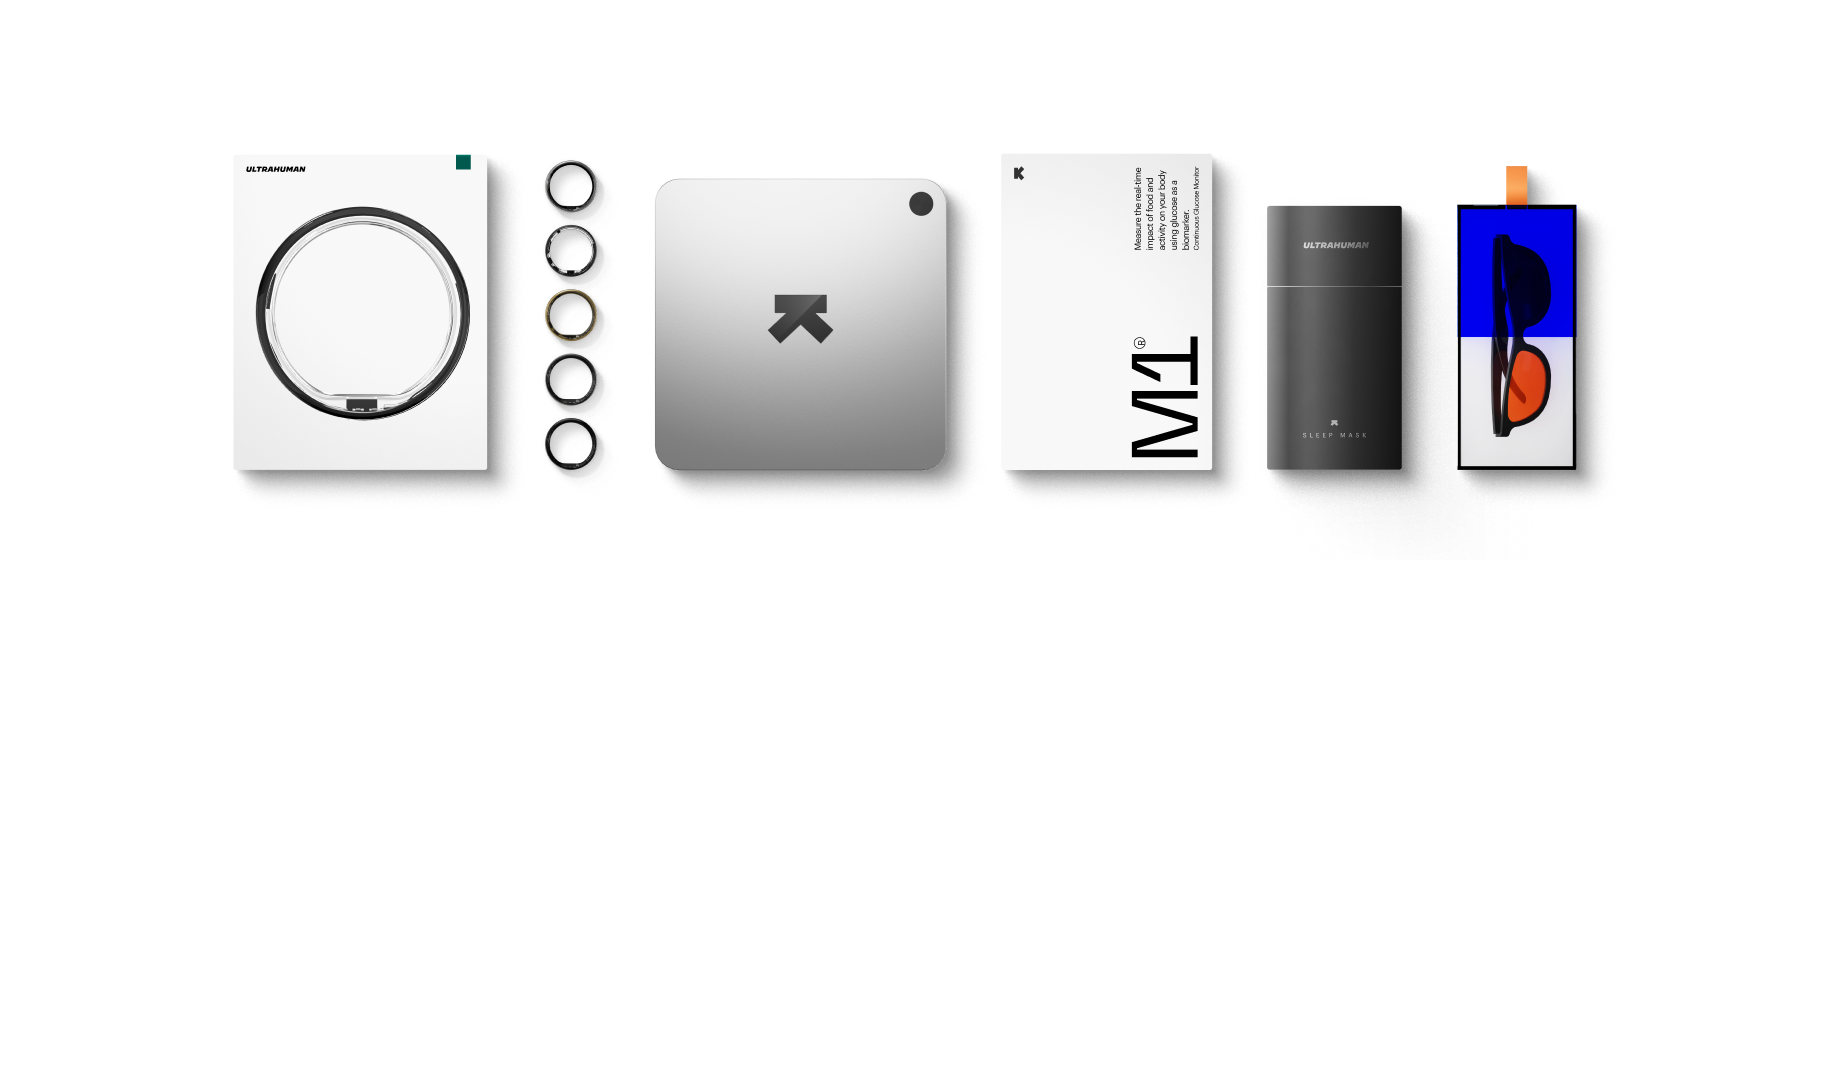
What Ultrahuman builds sits on top of that signal. The platform reads the sensor over Bluetooth, carries it across the sensor’s full wear life, and turns a stream of raw values into timing, patterns and the Metabolic Score. None of it is intended for diagnosis.