



Metabolic health1,456 members
Does your blood sugar follow you to bed?
The quarter of members with the most time in a tight glucose band slept with heart rates 8.3 bpm lower than the quarter with the least.
Medically reviewed by Mukul Mittal, MD
Ultrahuman paired the Ultrahuman Ring with a continuous glucose monitor for 1,456 members across 120 nights from December 2025 to April 2026. The members whose glucose sat in a tight target band the longest also ran the calmest hearts overnight.
The figure in this piece answers to a number of your own — type yours where the plate says Ask our data.
Members who spent more of the day inside Ultrahuman's tight time-in-target band — glucose between 70 and 110 mg/dL — ran a calmer overnight heart. Sorted into four equal groups by their time in target, overnight resting heart rate stepped from 63.6 beats per minute in the lowest group to 55.3 in the highest, and heart rate variability rose alongside it. How high glucose ran mattered more than how much it swung.
The numbers
The heart's overnight settings track the share of the day glucose spent in the 70 to 110 mg/dL band more than how much it swung.
- The four groups sat at 20%, 62%, 78% and 89% of the day inside the 70 to 110 mg/dL band.
- Overnight resting heart rate ran 8.3 bpm lower in the highest group than in the lowest, on a range from 7.1 to 9.5 bpm.
- Heart rate variability ran 7.6 ms higher in the highest group than in the lowest, on a range from 5.9 to 9.3 ms.
Does steadier blood sugar come with a calmer overnight heart?
Ultrahuman's in-app time in target is the share of the day glucose sits between 70 and 110 mg/dL — a tight, near-normal band — and it is not the wider clinical time in range. An international consensus panel drew that clinical band at 70 to 180 mg/dL, as a management target for people who already have diabetes [1]. Across these 1,456 members, the calmest hearts belonged to the group that held glucose in the tight band the longest. Whether it matters for people without diabetes is a live question. Bermingham and colleagues, writing in Nature Communications, are cautious: “longer-term health outcomes are required to demonstrate whether CGM monitoring has utility for health management in euglycaemic individuals” [2]. Figure 1 shows the step across the four groups.
Figure 1 · Interactive
A calmer overnight heart lines up with more time in target
Mean overnight resting heart rate steps from 63.6 bpm in the lowest time-in-target group to 55.3 in the highest.
Ask Our Data
Answered on this page — nothing you type leaves itThe share of the day the app shows inside the 70 to 110 mg/dL band.
1,456 members · the Ultrahuman Ring and a continuous glucose monitor
Bar chart of mean overnight resting heart rate for four glucose time-in-target groups across 1,456 Ultrahuman members, ordered lowest to highest, reading 63.6, 57.8, 55.8 and 55.3 beats per minute.
Why would glucose and the resting heart move together?
The same nervous system runs both. The vagus nerve that slows a resting heart also steadies the beat-to-beat spacing that heart rate variability measures, and glucose handling leans on that same autonomic balance. In 7,690 general-population residents aged 35 to 79, a higher long-term glucose marker tracked lower parasympathetic activity and higher sympathetic activity, though the researchers called the links weak [3]. Across large follow-up studies, a higher resting heart rate has itself tracked higher cardiovascular and all-cause mortality, an association that holds after accounting for the usual risk factors and runs stronger in men [4]. None of this makes glucose the sole driver, but the heart and the day's glucose read the same state, which is why they move together on the Ring.
Is it how high your glucose runs, or how much it swings?
How high glucose runs carries most of the gap. The same four groups tell the story in glucose terms: mean glucose fell from 148 mg/dL in the lowest time-in-target group to 88 mg/dL in the highest, and the resting heart rate followed. Day-to-day swings add a little on top, but most of that swing travels with the level rather than apart. That the level does most of the work fits what a monitor sees in ordinary people. Wearing one, people whose standard test read normal still reached prediabetic and diabetic glucose ranges 15% and 2% of the time [5]. And among 1,002 adults eating identical meals, glucose responses varied widely from one person to the next [6]. What tracked the calmer night here was the share of the whole day in target rather than any single reading.
What this analysis can't tell you
This analysis is observational, and it describes an association rather than a cause. Members with less time in target also tend to carry more body fat and lower fitness, and each of those goes with a higher resting heart rate and lower variability on its own. The analysis does not adjust for them, so some of the heart gap belongs to them rather than to glucose. Everyone here also chose to wear a Ring and a glucose monitor and watch their numbers, so this cohort is more attentive than most. The comparison rests on 1,456 members — 1,013 men and 443 women, aged 18 to 75 — and the outcome studies it leans on describe predicted risk, not events anyone lived through.
What this means for you
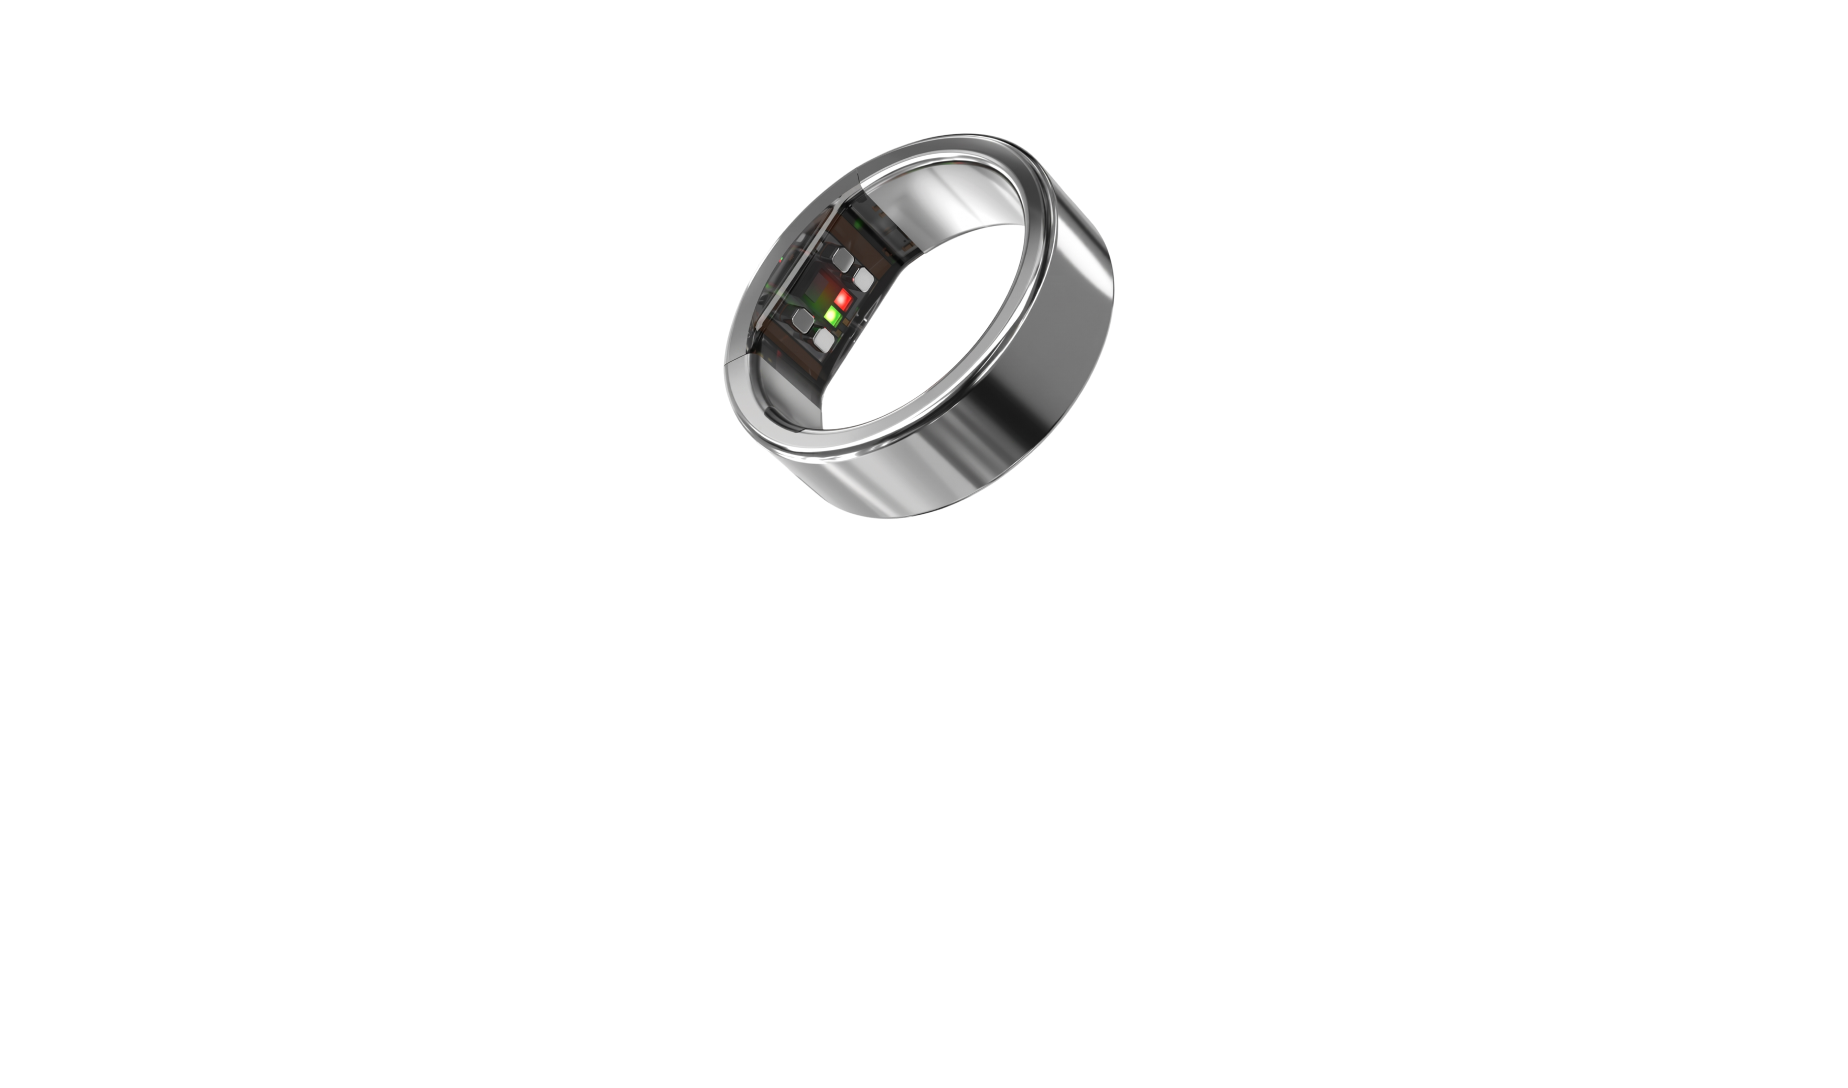
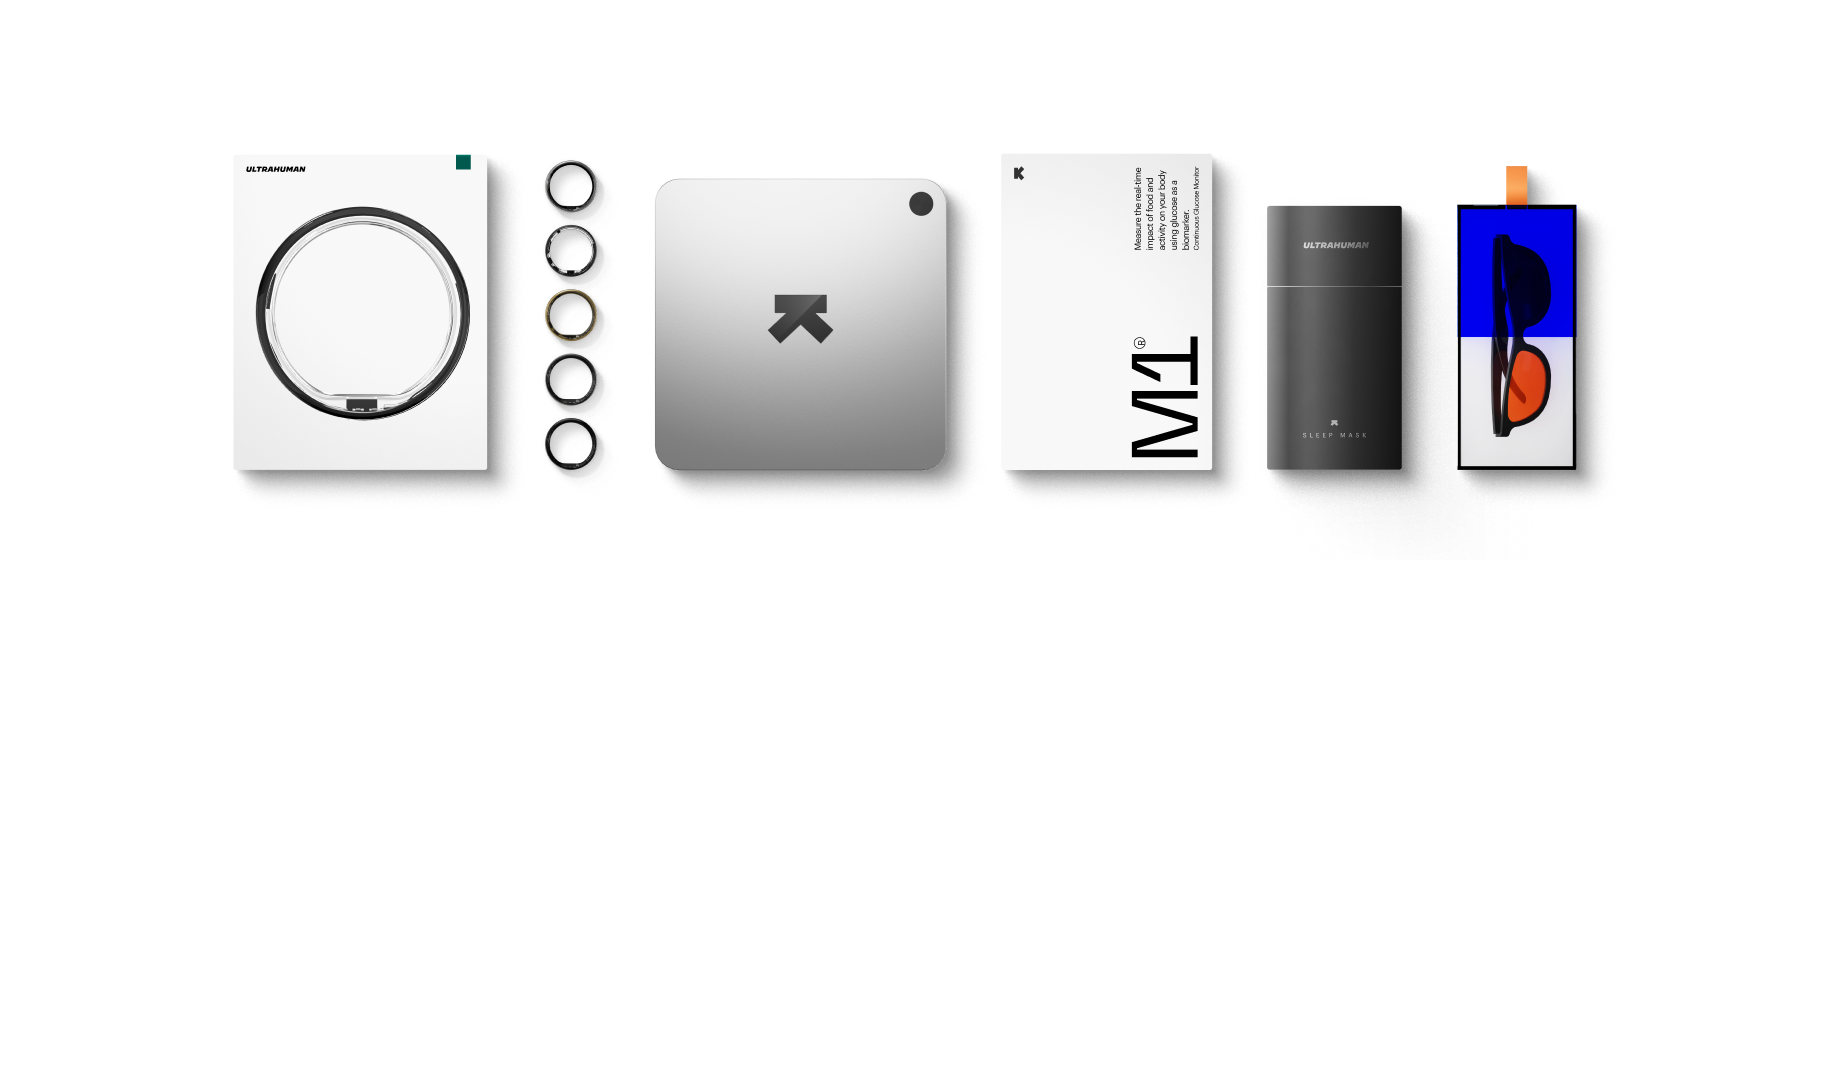
More time with your glucose in a tight, near-normal band lined up with a calmer overnight heart here. If you track glucose, watch how much of your day sits in target rather than any single spike, and check whether your steadier days are also your calmer nights. A few ordinary weeks is enough to see your own pattern: the Ultrahuman M1 CGM tracks your time in target through the day, while the Ultrahuman Ring reads the overnight heart rate it lined up with here.
Frequently asked questions
My glucose already sits in range most of the day. What should I watch?
The useful thing to watch is how much of your whole day sits in the tight 70 to 110 mg/dL band. A single spike after a meal is normal and passes. What lined up with a calmer overnight heart here was the share of the day spent in target, so track that share and how your overnight heart rate moves with it.
Why does my in-app time in target read lower than a clinical time in range?
The two use different windows. Ultrahuman's time in target scores the share of the day glucose sits between 70 and 110 mg/dL, against the wider 70 to 180 mg/dL of a clinical time in range. The same day scores lower against the tighter band, which is all the difference is.
Who does this analysis not apply to?
Anyone already living with diabetes, whose glucose and heart answer to other things. It also does not describe people who never wore both devices, since every reading here comes from members who chose to track their own glucose and sleep. And because more body fat and lower fitness were not accounted for, this is a pattern inside an attentive group, not a rule for any one person.
References
- Battelino T, et al. Diabetes Care 2019. PMID: 31177185.
- Bermingham KM, et al. Nature Communications 2026. PMID: 41896538.
- Takahashi N, et al. Diabetes Research and Clinical Practice 2020. PMID: 32243903.
- Tadic M, et al. European Journal of Clinical Investigation 2018. PMID: 29355923.
- Hall H, et al. PLoS Biology 2018. PMID: 30040822.
- Berry SE, et al. Nature Medicine 2020. PMID: 32528151.
This is an observational analysis of Ultrahuman member data. It describes associations, not causation, and it is not a diagnosis or a substitute for medical advice.