



Metabolic health1,596 members
Is your normal blood-sugar test hiding something?
Four in ten members with a normal result still spike past 140 mg/dL on an average day.
Medically reviewed by Mukul Mittal, MD
Ultrahuman paired a glycated haemoglobin (HbA1c) blood test with continuous glucose monitor readings for 1,596 members, from blood draws between August 2025 and July 2026. The clinical glucose range was too wide to separate a normal result from a pre-diabetic one.
Figure 2 answers to a number of your own — type yours where the plate says Ask our data.
Members with a normal HbA1c and members with a pre-diabetic HbA1c spent almost the same share of the day inside the clinical 70 to 180 mg/dL range, 91.7% against 93.5%, across the 1,267 members in those two bands. That 180 ceiling was built for diabetes management. Move it to 140 mg/dL and the share of the day above the line separates them, 2.8% against 8.8%.
The numbers
The clinical range cannot separate the two non-diabetic bands.
- Members in the normal band spent 91.7% of the day inside the clinical 70 to 180 mg/dL range against 93.5% for the pre-diabetic band, a gap chance alone could produce (p = 0.11 across the 1,267 members in those two bands).
- Above 140 mg/dL the normal band averaged 41 minutes a day, the pre-diabetic band 2 hours 7 minutes and the diabetic band 11 hours 5 minutes. The gap between the normal and pre-diabetic bands above 140 mg/dL is real and moderate rather than small (p < 0.001, Cliff's delta 0.40).
- Ultrahuman's time in target uses a tighter 70 to 110 mg/dL window, where the normal band spends 75.0% of the day and the pre-diabetic band 63.7%.
What is your blood-sugar test measuring?
Your blood-sugar test reports an average. An HbA1c is the share of your haemoglobin carrying glucose, which covers roughly three months. Below 5.7% is normal, 5.7 to 6.4% is pre-diabetic and 6.5% or above is diabetic. That percentage averages everything; no single day is visible in it.
Every glucose range you see is bounded by thresholds someone chose. Clinical time in range counts the share of the day between 70 and 180 mg/dL, milligrams per decilitre, where 70 is the low-glucose line and 180 the high one. An international consensus panel set that 180 as a management target for people who already have diabetes [1]. In adults with type 1 diabetes, the same time in range mapped to a wide spread of HbA1c values, because the two do not measure the same thing [2].
What changes when you move the line down to 140 mg/dL?
Drop the ceiling from 180 mg/dL to 140 mg/dL and the gap between the two non-diabetic bands opens more than threefold. The share of the day above 180 mg/dL sits near zero in both non-diabetic bands, 0.3% and 1.5%. Figure 1 shows both thresholds against all three bands. The members under its paired bars are the same people; the bars differ only in where the threshold sits.
Figure 1 · Interactive
At the clinical ceiling, only the diabetic band lifts off the floor
Share of the day spent above each glucose line, by HbA1c band.
1,596 members · a laboratory blood test and a continuous glucose monitor
Grouped bar chart of the share of the day above 140 mg/dL and above 180 mg/dL by HbA1c band across 1,596 Ultrahuman members, reading 2.8% and 0.3% for normal, 8.8% and 1.5% for pre-diabetic, and 46.2% and 23.0% for diabetic.
The 140 line has a reference behind it. In 153 healthy people without diabetes, aged 7 to 80, wearing a monitor whose readings they could not see, the median time above 140 mg/dL was 2.1% of the day, about half an hour [3]. That is a median, so half spent longer, and everyone was screened for health and weight, so it is a best case. Our normal band's median sits below that benchmark at 0.9% of the day. The 2.8% for the same band is an average, lifted by a minority of members whose days run much higher. People who look unremarkable on a standard blood test still record real time at elevated glucose on a monitor [4].
The average daily glucose peak tells the same story in levels rather than shares: 137 mg/dL in the normal band, 155 mg/dL in the pre-diabetic band and 225 mg/dL in the diabetic band.
Does a normal result mean your days look normal too?
A normal HbA1c is mostly reassuring, and nothing here changes that. What it does not tell you is how high your own days run. Two members can hand in the same result and live very different days. Figure 2 gives every member one dot, and a wide slice of the normal band sits above the 140 mg/dL line.
Figure 2 · Interactive
Members who share an HbA1c band do not share a day
Each dot is one member: their HbA1c against their own average daily glucose peak.
Ask Our Data
Answered on this page — nothing you type leaves itEither value answers on its own; together they place your dot.
1,596 members · a laboratory blood test and a continuous glucose monitor
Scatter plot of average daily glucose peak against HbA1c for 1,596 Ultrahuman members, with shaded columns for the three HbA1c bands and a dashed line at 140 mg/dL. 349 of the 878 members in the normal band, 40%, sit above that line, and 25 members fall outside the plotted frame.
Some of the disagreement is in the instrument. Tozzo and colleagues, writing in Diabetes Care, put it conditionally: “there may be a stable nonglycemic source of inaccuracy” in how an HbA1c maps onto measured glucose [5]. That cohort was mostly people with type 1 diabetes, so how far the gap carries to a normal result is not established.
What this analysis can't tell you
This analysis is cross-sectional: three groups at one time point, nobody followed over time. The cohort is self-selected, so this is a pattern inside that group, not a population rate. An HbA1c covers about three months, and the glucose window here is a median of 16 days inside it. Sensor readings are less reliable below 70 mg/dL, one reason the full range looks flat here. The outcome evidence does not carry over either: the study linking time in range to eye damage ran in people who already have diabetes, where less time in range tracked with worse eye damage even at the same HbA1c [6]. None of that transfers to a metabolically healthy member.
What this means for you
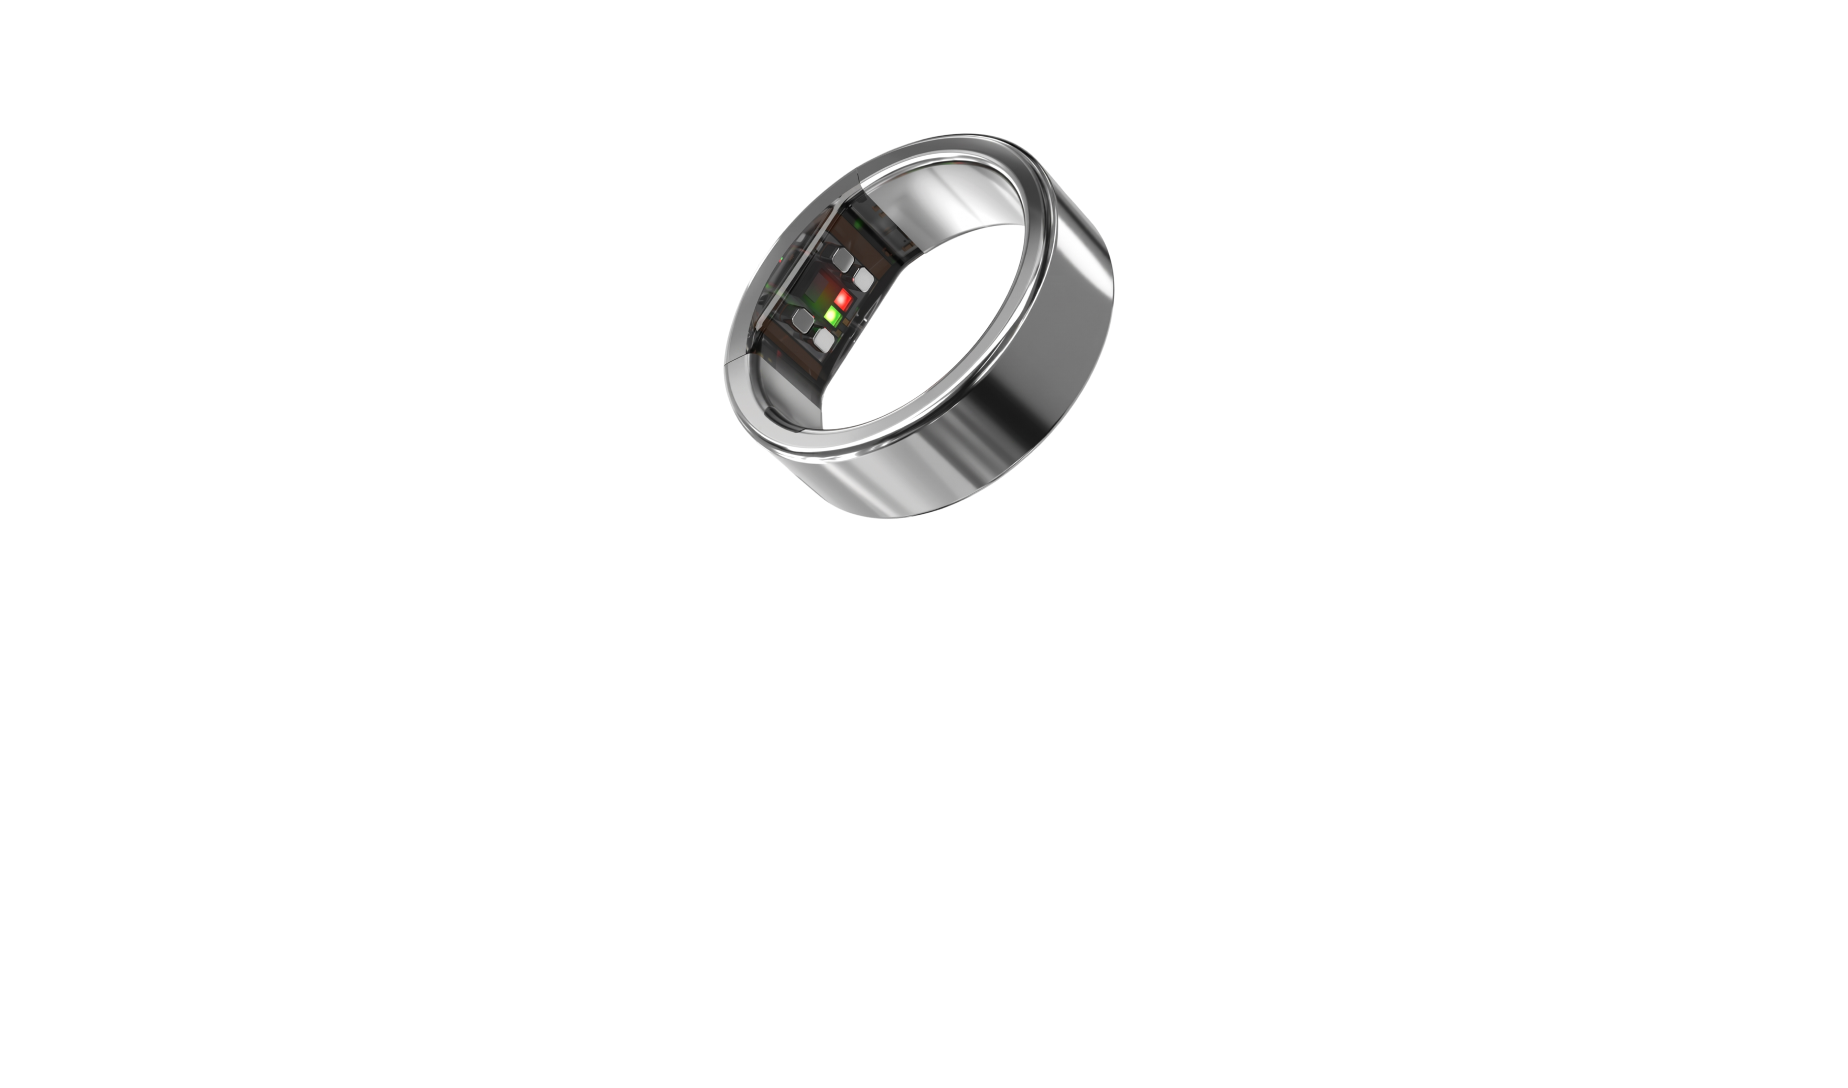
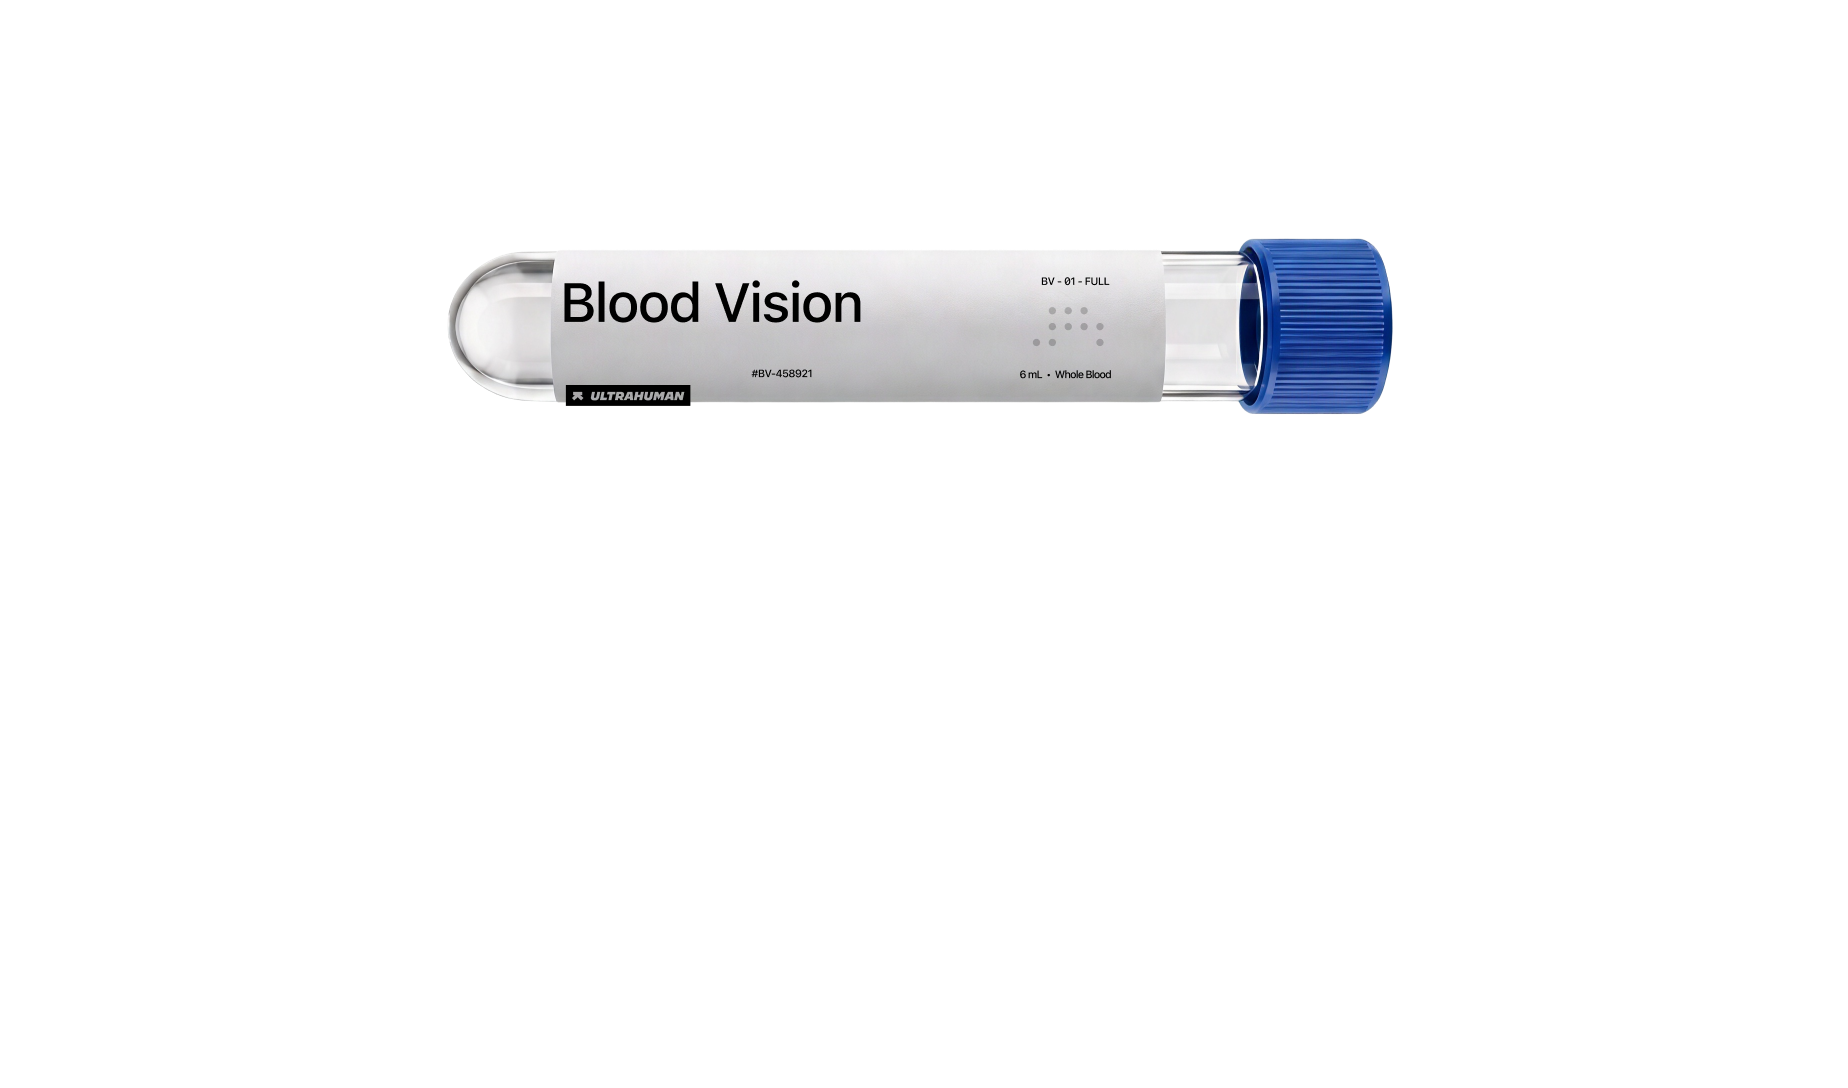
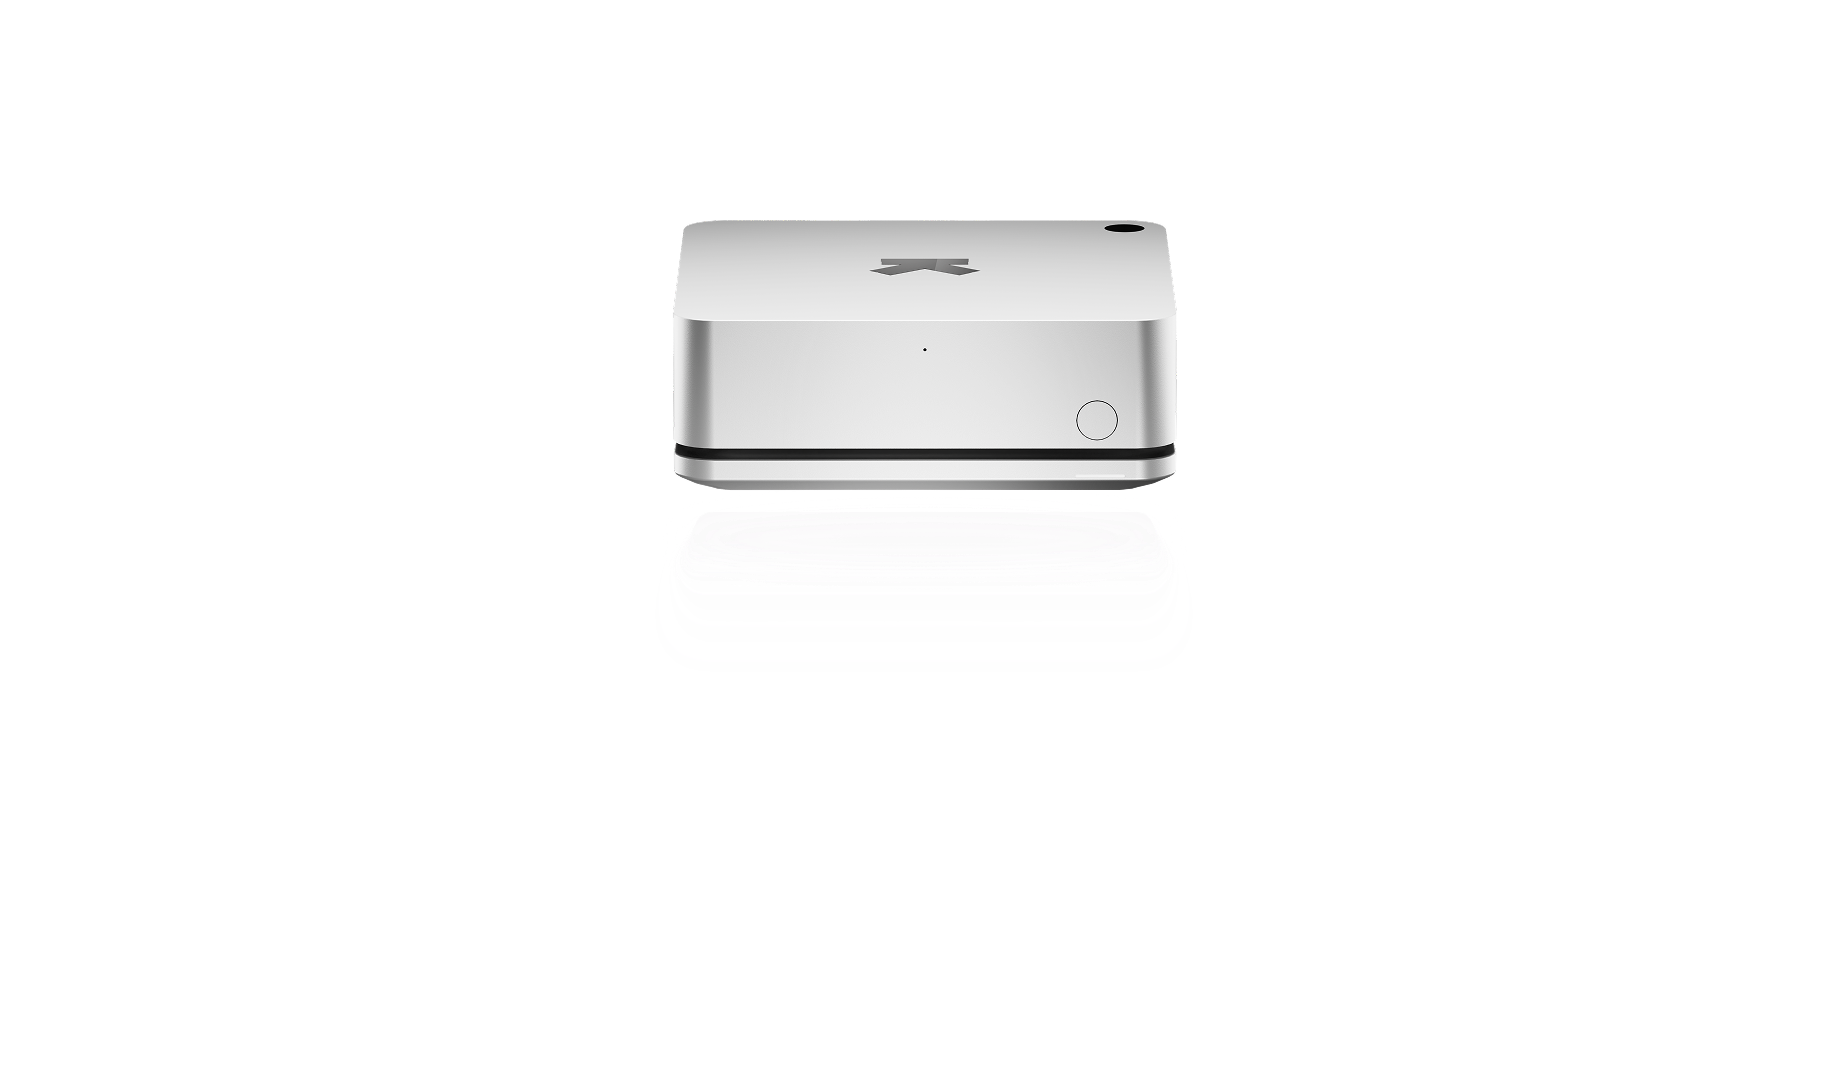
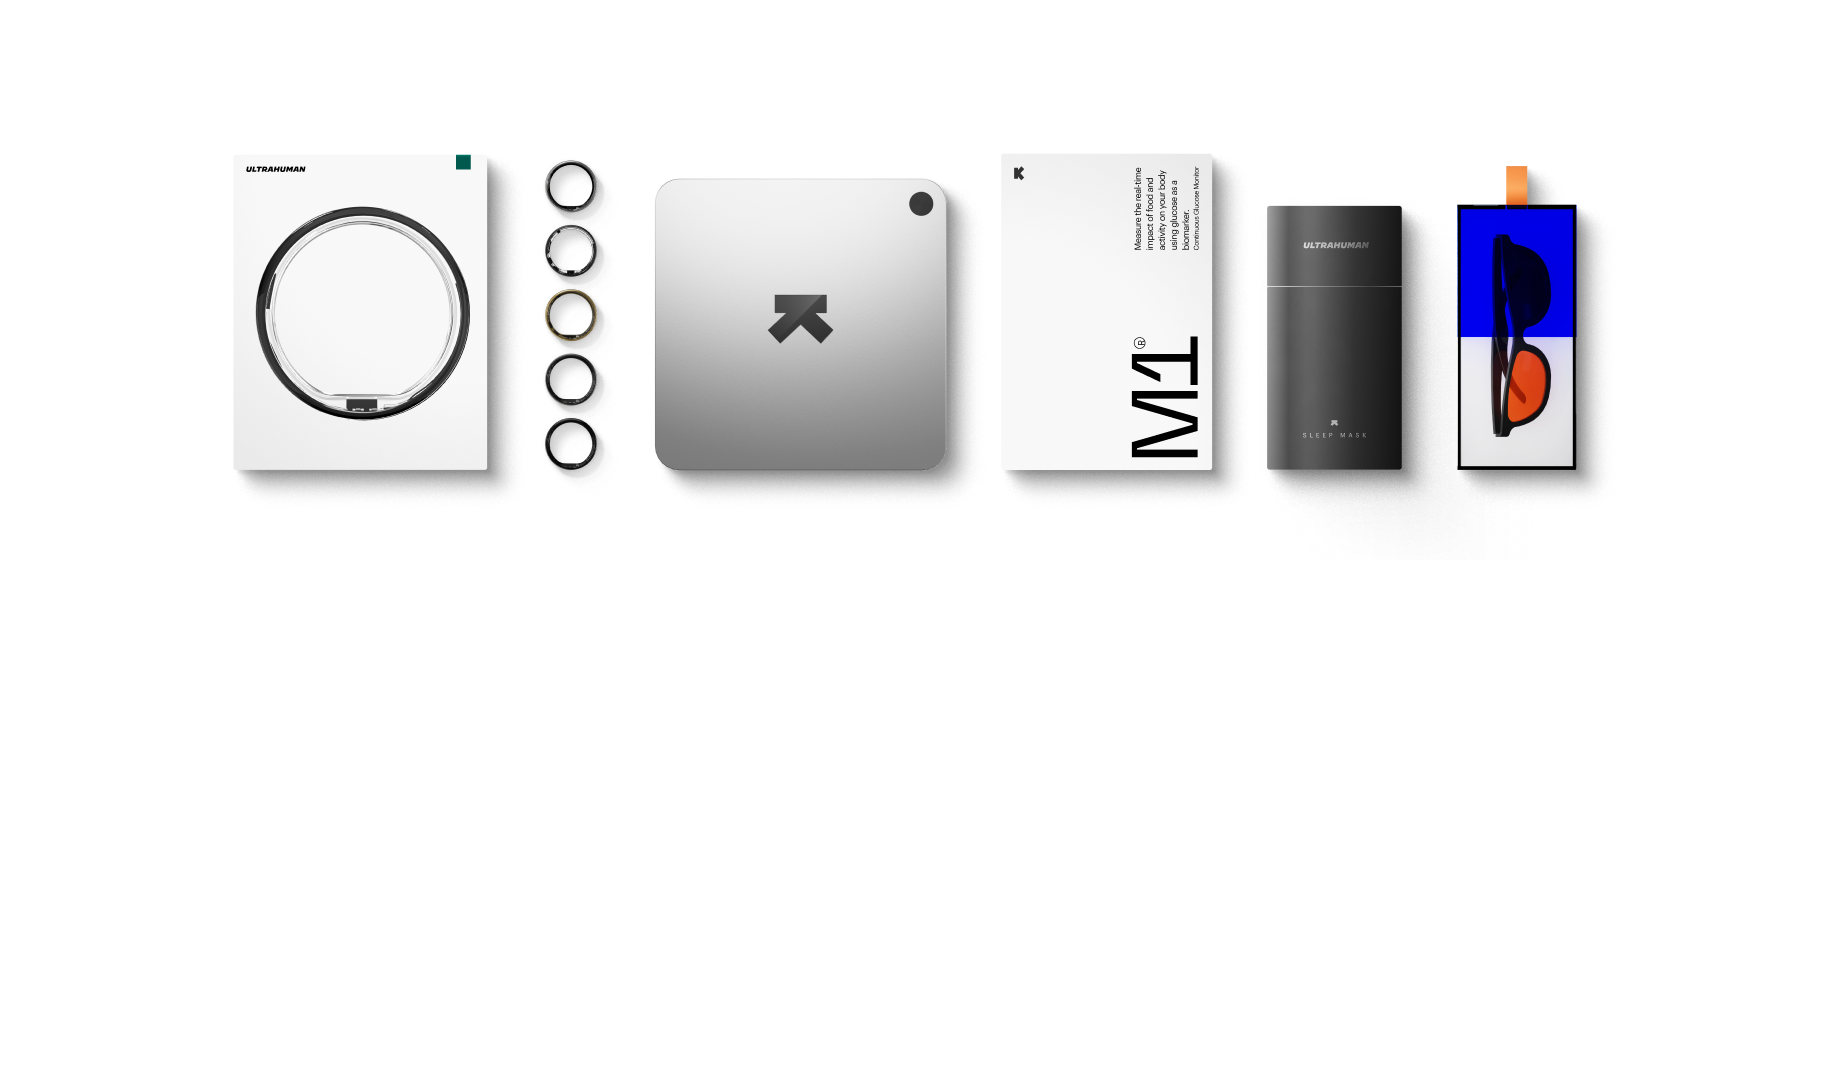
A normal blood-sugar result and a day that regularly climbs past 140 mg/dL can belong to the same person, and both are worth knowing. If you already track glucose, the daily glucose peak is the number this gap shows up in; the clinical 180 mg/dL ceiling did not separate the two non-diabetic bands here. Finding out takes a few ordinary weeks, and a pattern that worries you is one to discuss with your clinician. The Ultrahuman M1 CGM records the daily glucose peaks this analysis is built on, and Ultrahuman Blood Vision runs the HbA1c it is paired against.
Frequently asked questions
What should I do if my HbA1c is normal but my glucose peaks above 140?
The useful question is what caused them. A peak is a response to something specific, so the step that helps is finding what yours line up with, usually a particular meal or a short night. Members here wore a monitor for a median of 16 days. Nothing here is a diagnosis, so take a pattern that worries you to a clinician.
Why does my in-app time in target read lower than a clinical time in range?
The two use different windows. Ultrahuman's time in target scores the share of the day between 70 and 110 mg/dL, against 70 to 180 for a clinical time in range. Rebuilt from raw sensor readings, the metric reproduced the in-app value closely against the tighter window (Pearson correlation 0.972) and not against the wider one. The app number reads lower because it scores your day against a tighter window.
Who does this analysis not apply to?
The 140 mg/dL comparison exists to tell two non-diabetic bands apart, so it says nothing new about members already living with diabetes, whose figures sit alongside the others above. It also does not hold for anyone whose HbA1c is skewed by a condition that changes red blood cell lifespan, since the test then reflects how long those cells live as much as glucose.
References
- Battelino T, et al. Diabetes Care 2019. PMID: 31177185.
- Beck RW, et al. Journal of Diabetes Science and Technology 2019. PMID: 30636519.
- Shah VN, et al. The Journal of Clinical Endocrinology and Metabolism 2019. PMID: 31127824.
- Hall H, et al. PLoS Biology 2018. PMID: 30040822.
- Tozzo V, et al. Diabetes Care 2024. PMID: 38394636.
- Lu J, et al. Diabetes Care 2018. PMID: 30201847.
This is an observational analysis of Ultrahuman member data. It describes associations, not causation, and it is not a diagnosis or a substitute for medical advice.