




Glucose time in range explained
Medically reviewed by Mukul Mittal, MD
Glucose time in range is the share of a day your glucose readings sit inside a chosen band, reported as a percentage.
The Ultrahuman M1 Live CGM, sold as M2 Live in the US, scores you against a tight band of 70 to 110 mg/dL.
In this guide, we explain what time in range measures, why Ultrahuman uses a tighter band than diabetes care does, and how to understand your data.
Key takeaways
Time in range comes from M1 Live or M2 Live CGM readings taken every few minutes.
Ultrahuman scores against 70 to 110 mg/dL. The wider clinical band of 70 to 180 mg/dL was drawn for diabetes care.
Glucose variability is the other half of the picture. Two days can share an average and look nothing alike.
Glucose time in range explained
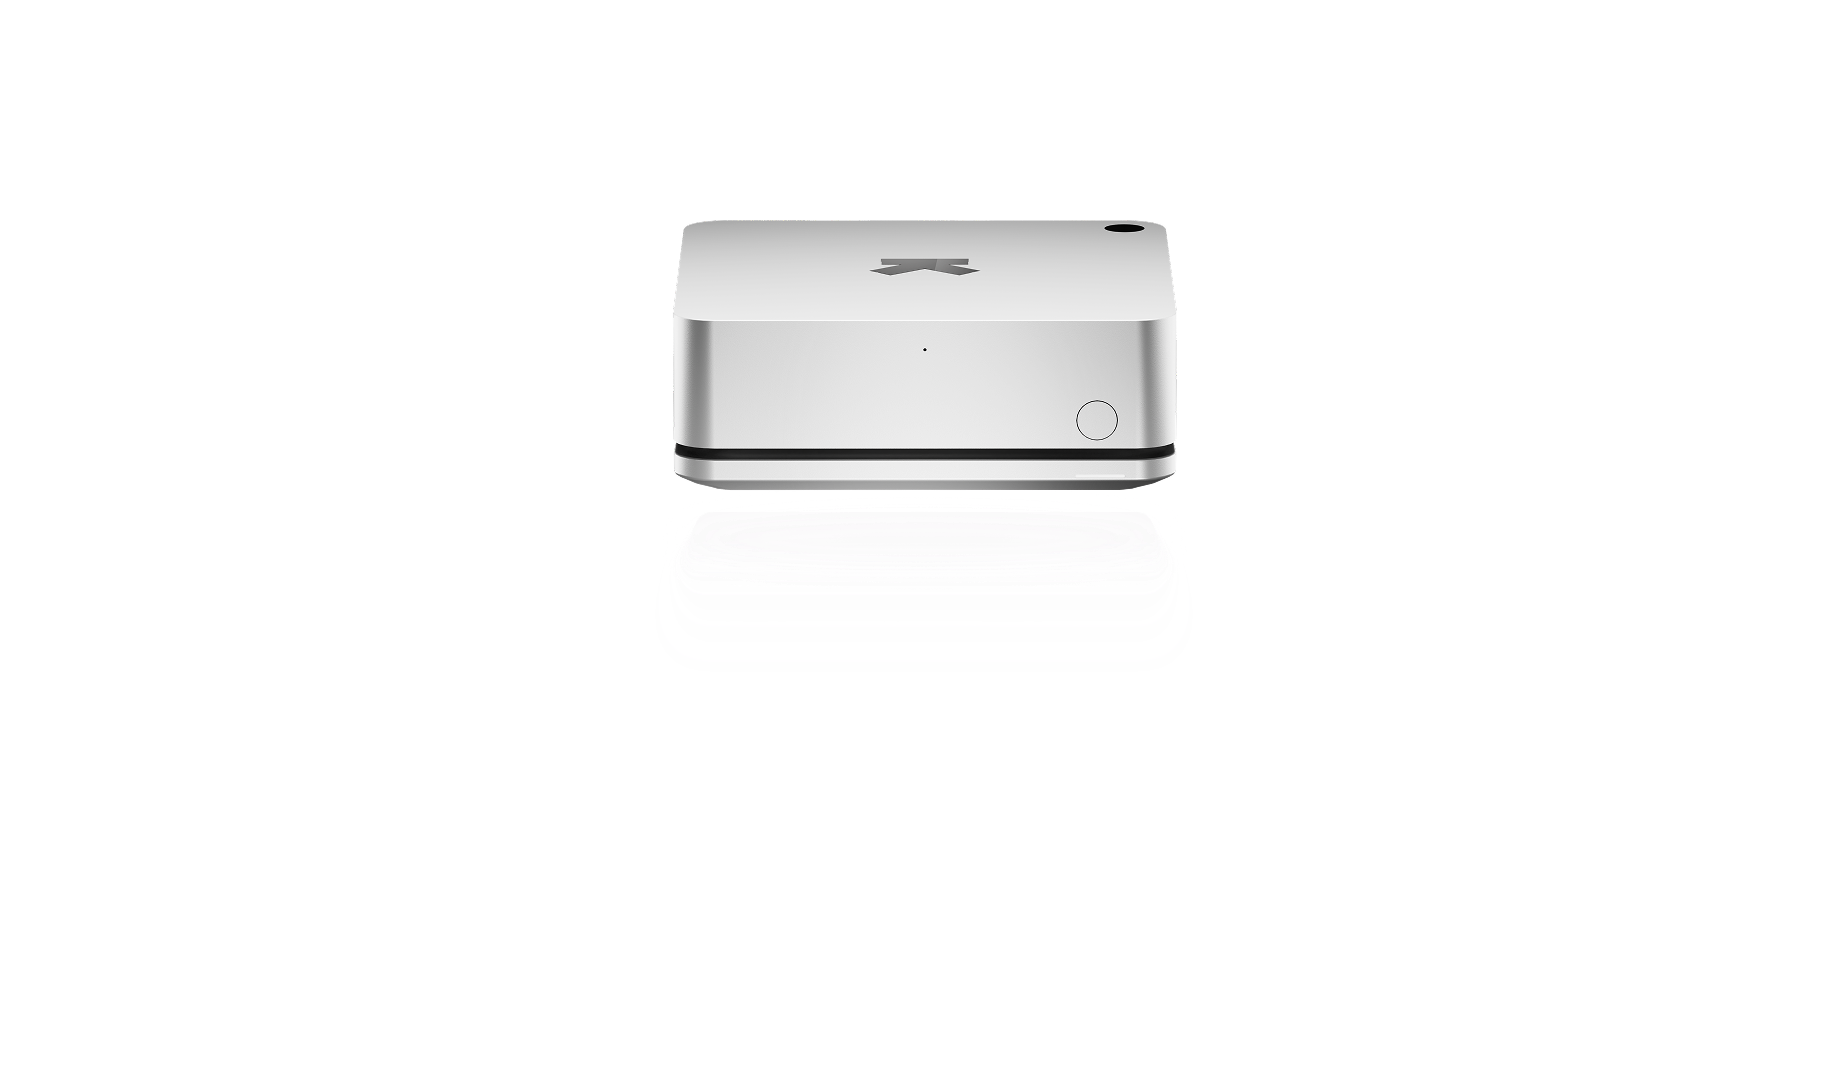
M1 Live and M2 Live are Ultrahuman's glucose platforms: a continuous glucose monitor (CGM) worn on the upper arm.
A continuous glucose monitor reads your glucose every few minutes, so a day produces hundreds of readings. Time in range is the percentage of those readings that fall inside a chosen glucose range.
What is glucose variability?
Glucose variability is the companion number, measuring how far readings swing around your own average, expressed as a percentage of that average. One day drifts gently. Another spikes after lunch and sinks by four. Both can average 100 mg/dL.
Why Ultrahuman uses a tighter band
Ultrahuman uses a healthy range narrower than the 70 to 180 mg/dL band established for diabetes care.
In 60 adults screened for normal glucose tolerance, time inside 70 to 180 mg/dL averaged 95.4%. A band that scores nearly everyone without diabetes as close to perfect tells you very little.
That’s why Ultrahuman M1/M2 Live uses a range of 70 to 110 mg/dL. This enables users to understand swings in their glucose and whether levels spike and remain elevated.
What the research says about time in range
For those with diabetes, an international consensus panel recommends a band of 70 to 180 mg/dL, more than 70% of the day inside it, and glucose variability at or under 36%.
Reference values for people without diabetes came later. A Framingham Heart Study sample of 1,175 adults found the 560 with normal glucose spent 87.0% of the time between 70 and 140 mg/dL, against 77.1% for the 463 with prediabetes.
Variability can be more revealing than averages: Of 57 adults who wore a monitor for two to four weeks, 38 counted as normal on standard glucose tests. About a quarter of those 38 showed the swing-heavy glucose pattern.
What Ultrahuman's data shows
The spread separates groups that fasting labels blur. Ultrahuman's M1 study followed 53 adults without diabetes and 52 with prediabetes for 14 days.
| Group, 14 days of CGM | Mean glucose | Glucose variability |
|---|---|---|
| Adults without diabetes (53) | 102.4 mg/dL | 15.8% |
| Adults with prediabetes (52) | 112.2 mg/dL | 17.3% |
Both numbers fell across the two weeks in both groups.
Both groups also sit far under the 36% variability line, which was drawn in diabetes care. Away from diabetes, the gaps between groups are small. Ultrahuman's 70 to 110 mg/dL band is a wellness range, not a clinical target, and time outside it is not by itself a sign of disease.
How to read time in range in the app
Time in range feeds your Metabolic Score, the daily number M1 Live and M2 Live produce. Tap into a day to see the glucose curve underneath it and the meals that shaped it.
Read the percentage next to what you actually did. A walk after dinner, a poor night, a late meal: each moves it, and the live curve shows which. A high percentage earned by skipping meals isn't the same as handling food well.
The number worth watching is the direction across two or three weeks.
Read the original research
All Studies →This explainer is based on original research by the Ultrahuman Science team. Explore the full Studies repository.
Frequently asked questions
Is time in range the same as time in target?
Usually yes. Both count the share of readings inside a band. What differs is the band, so check which one your app counts against before comparing your number to anyone else's.
Why does my CGM reading disagree with a finger prick?
The sensor reads the fluid around your cells rather than blood, and that fluid lags blood by a few minutes. The two agree most closely when glucose is flat. A gap right after a meal is expected, not a fault.
Can I change my time in range without changing what I eat?
Often, yes. Sleep and a walk after a meal both move the curve. Food is the biggest lever, not the only one.
How many days of data do I need before the number means anything?
A single day tells you about that day. Patterns need about two weeks, roughly the window the reference studies use.
Does a spike after a meal mean something is wrong?
No. Glucose is supposed to rise after eating. What matters is how high it goes and how long it takes to settle.
Does the Ultrahuman Ring measure my glucose?
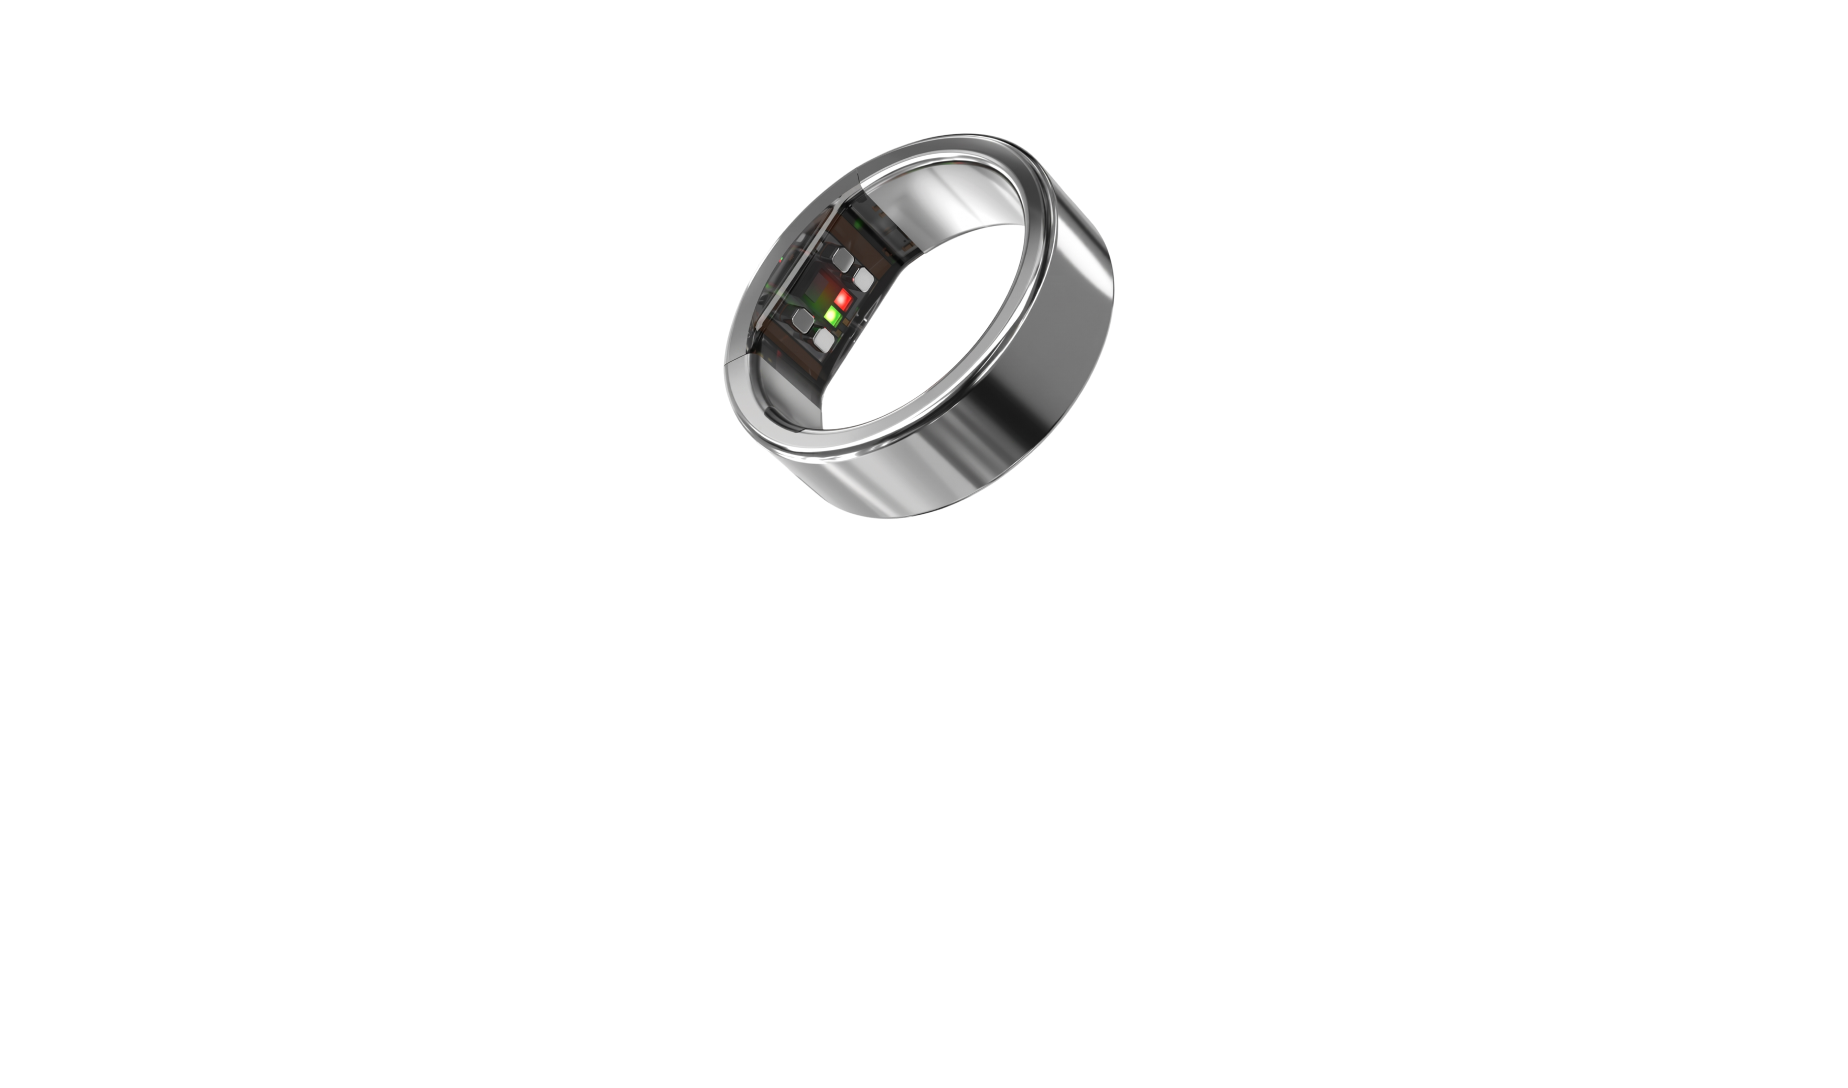
No. The Ring reads sleep, movement, heart rate and recovery from your finger. Glucose, time in range and the Metabolic Score all need M1 Live or M2 Live.
What's the difference between M1 Live and M2 Live?
They're the same platform on different sensors. M1 Live runs on the Abbott FreeStyle Libre. M2 Live, the US version, runs on Abbott Lingo. Both report time in range against the same 70 to 110 mg/dL band.
References
- Battelino T et al. Clinical targets for continuous glucose monitoring data interpretation: recommendations from the International Consensus on Time in Range. Diabetes Care 2019. PMID 31177185
- Sofizadeh S et al. Evaluation of reference metrics for continuous glucose monitoring in persons without diabetes and prediabetes. Journal of Diabetes Science and Technology 2022. PMID 33100059
- Spartano NL et al. Defining continuous glucose monitor time in range in a large, community-based cohort without diabetes. Journal of Clinical Endocrinology and Metabolism 2025. PMID 39257191
- Hall H et al. Glucotypes reveal new patterns of glucose dysregulation. PLoS Biology 2018. PMID 30040822
- Chaudhry M et al. Metabolic health tracking using Ultrahuman M1 continuous glucose monitoring platform in non- and pre-diabetic Indians: a multi-armed observational study. Scientific Reports 2024. PMID 38499685
Time in range and glucose variability describe associations in sensor data, not cause and effect. They are not a medical diagnosis. If a reading surprises you or you feel unwell, bring it to your physician.
